

Analytics dashboard
The Analytics tab provides aggregate metrics across agents over a selected date range.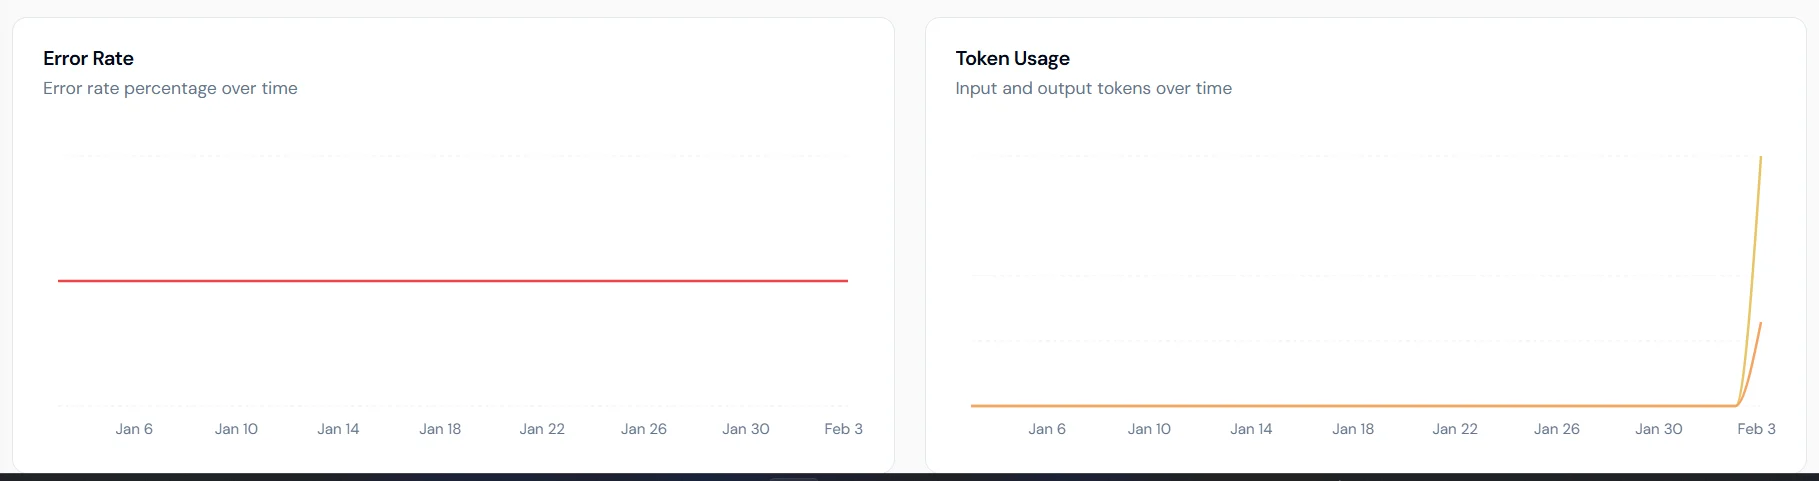
- Error Rate: percentage of failed executions over time.
- Token Usage: breakdown of input and output tokens.
- Latency Trends: average and P95 latency to surface performance bottlenecks.
- Credits Consumed: daily credit usage trends.
Traces
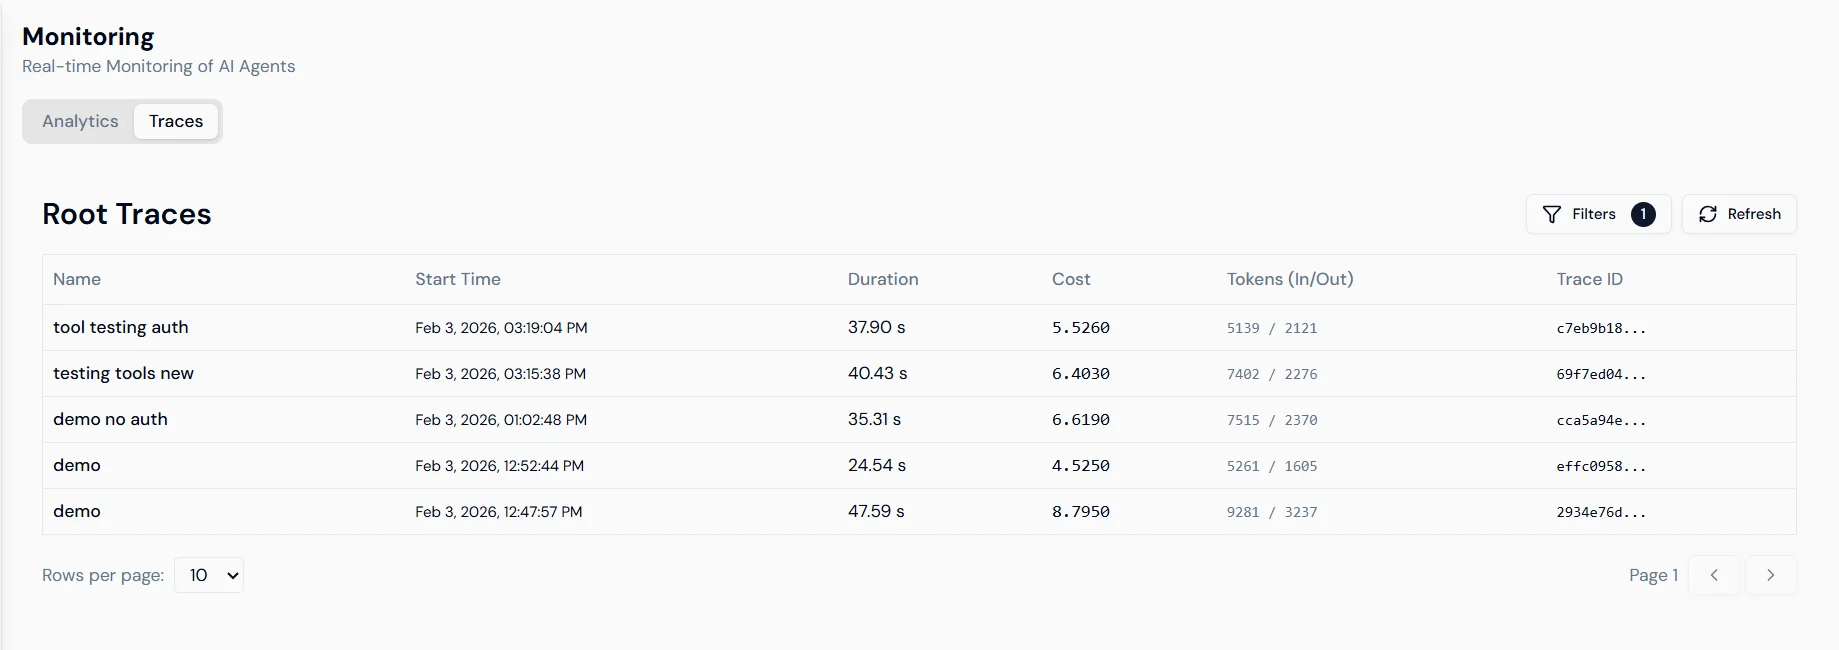
The Traces tab shows individual execution records for every agent run.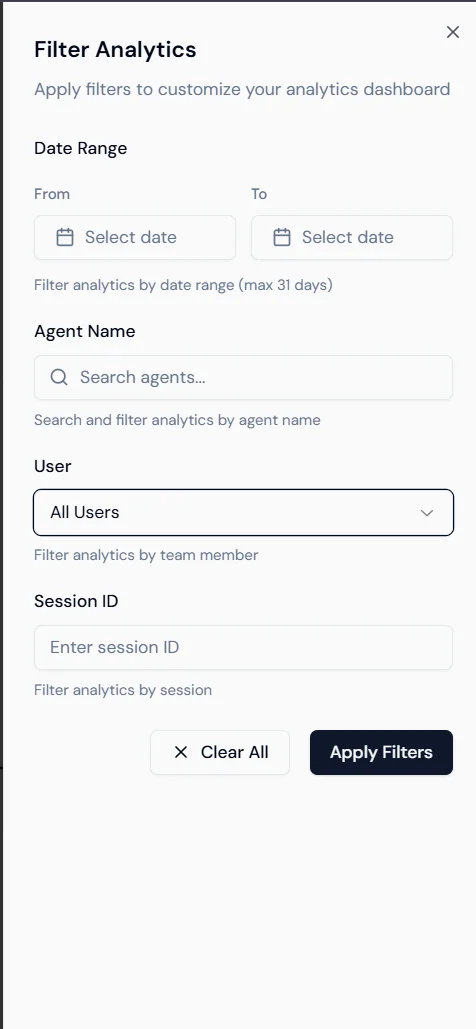
Trace detail
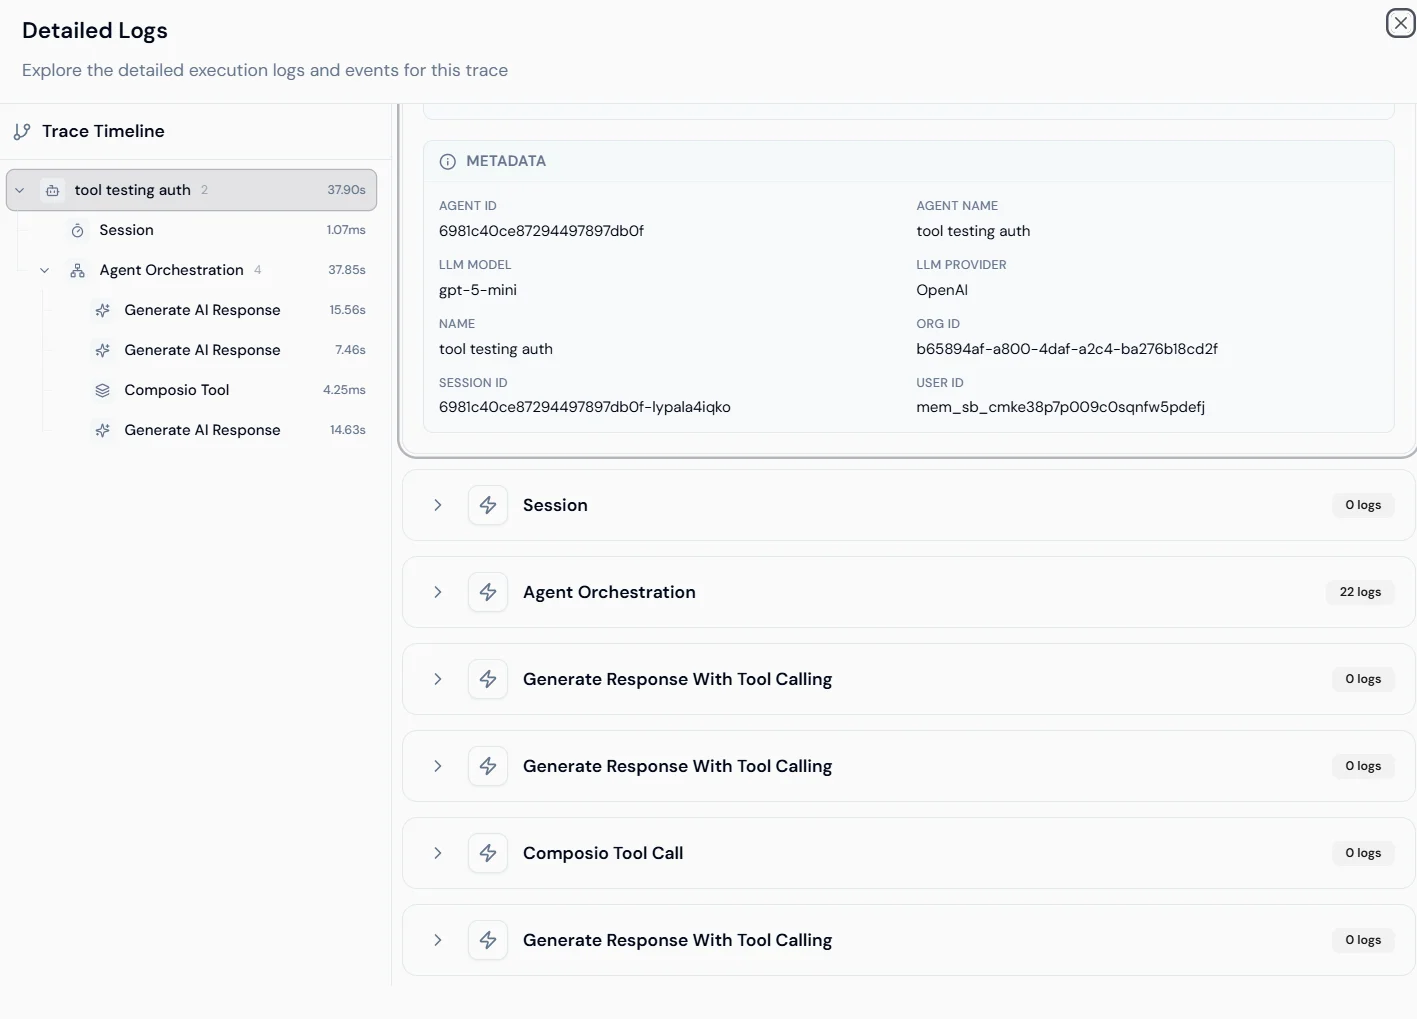
Selecting a trace opens the execution timeline for that run.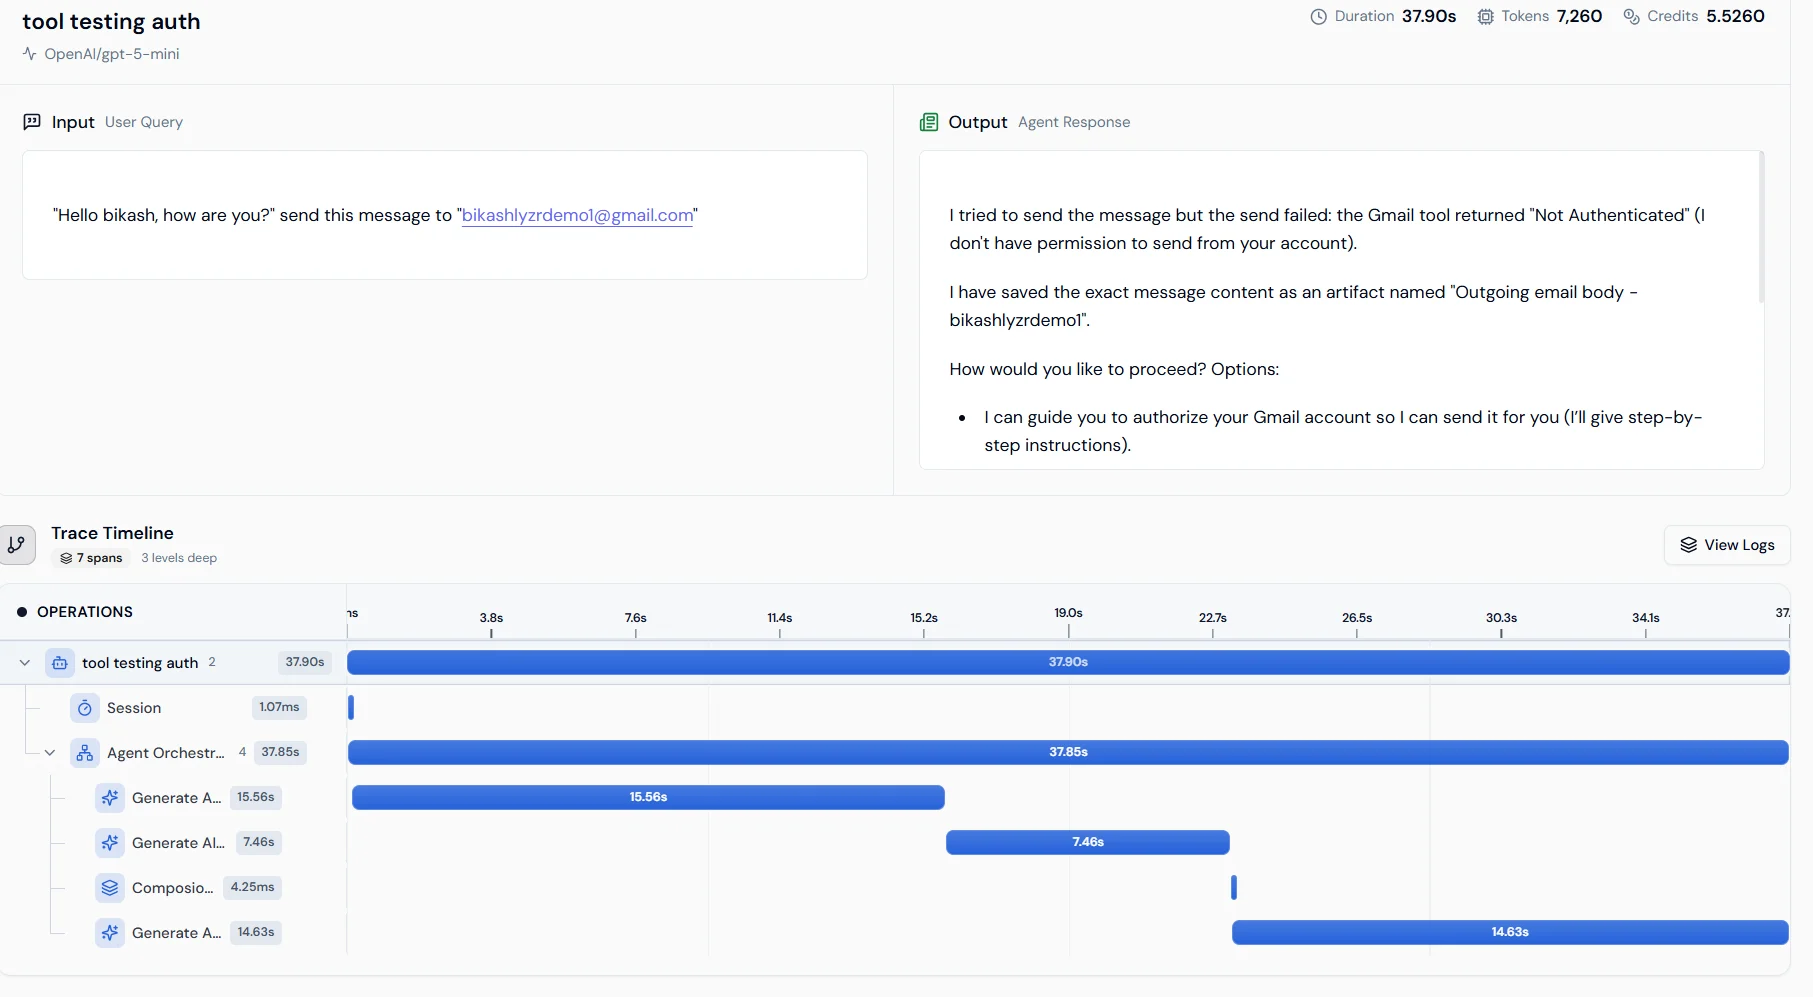
Generate insights for a trace
Each trace detail view has a Generate Insights action that runs a utility agent over the trace and returns a structured review of that run. Use it to understand a long or failed execution quickly, without reading every span in the operation waterfall by hand.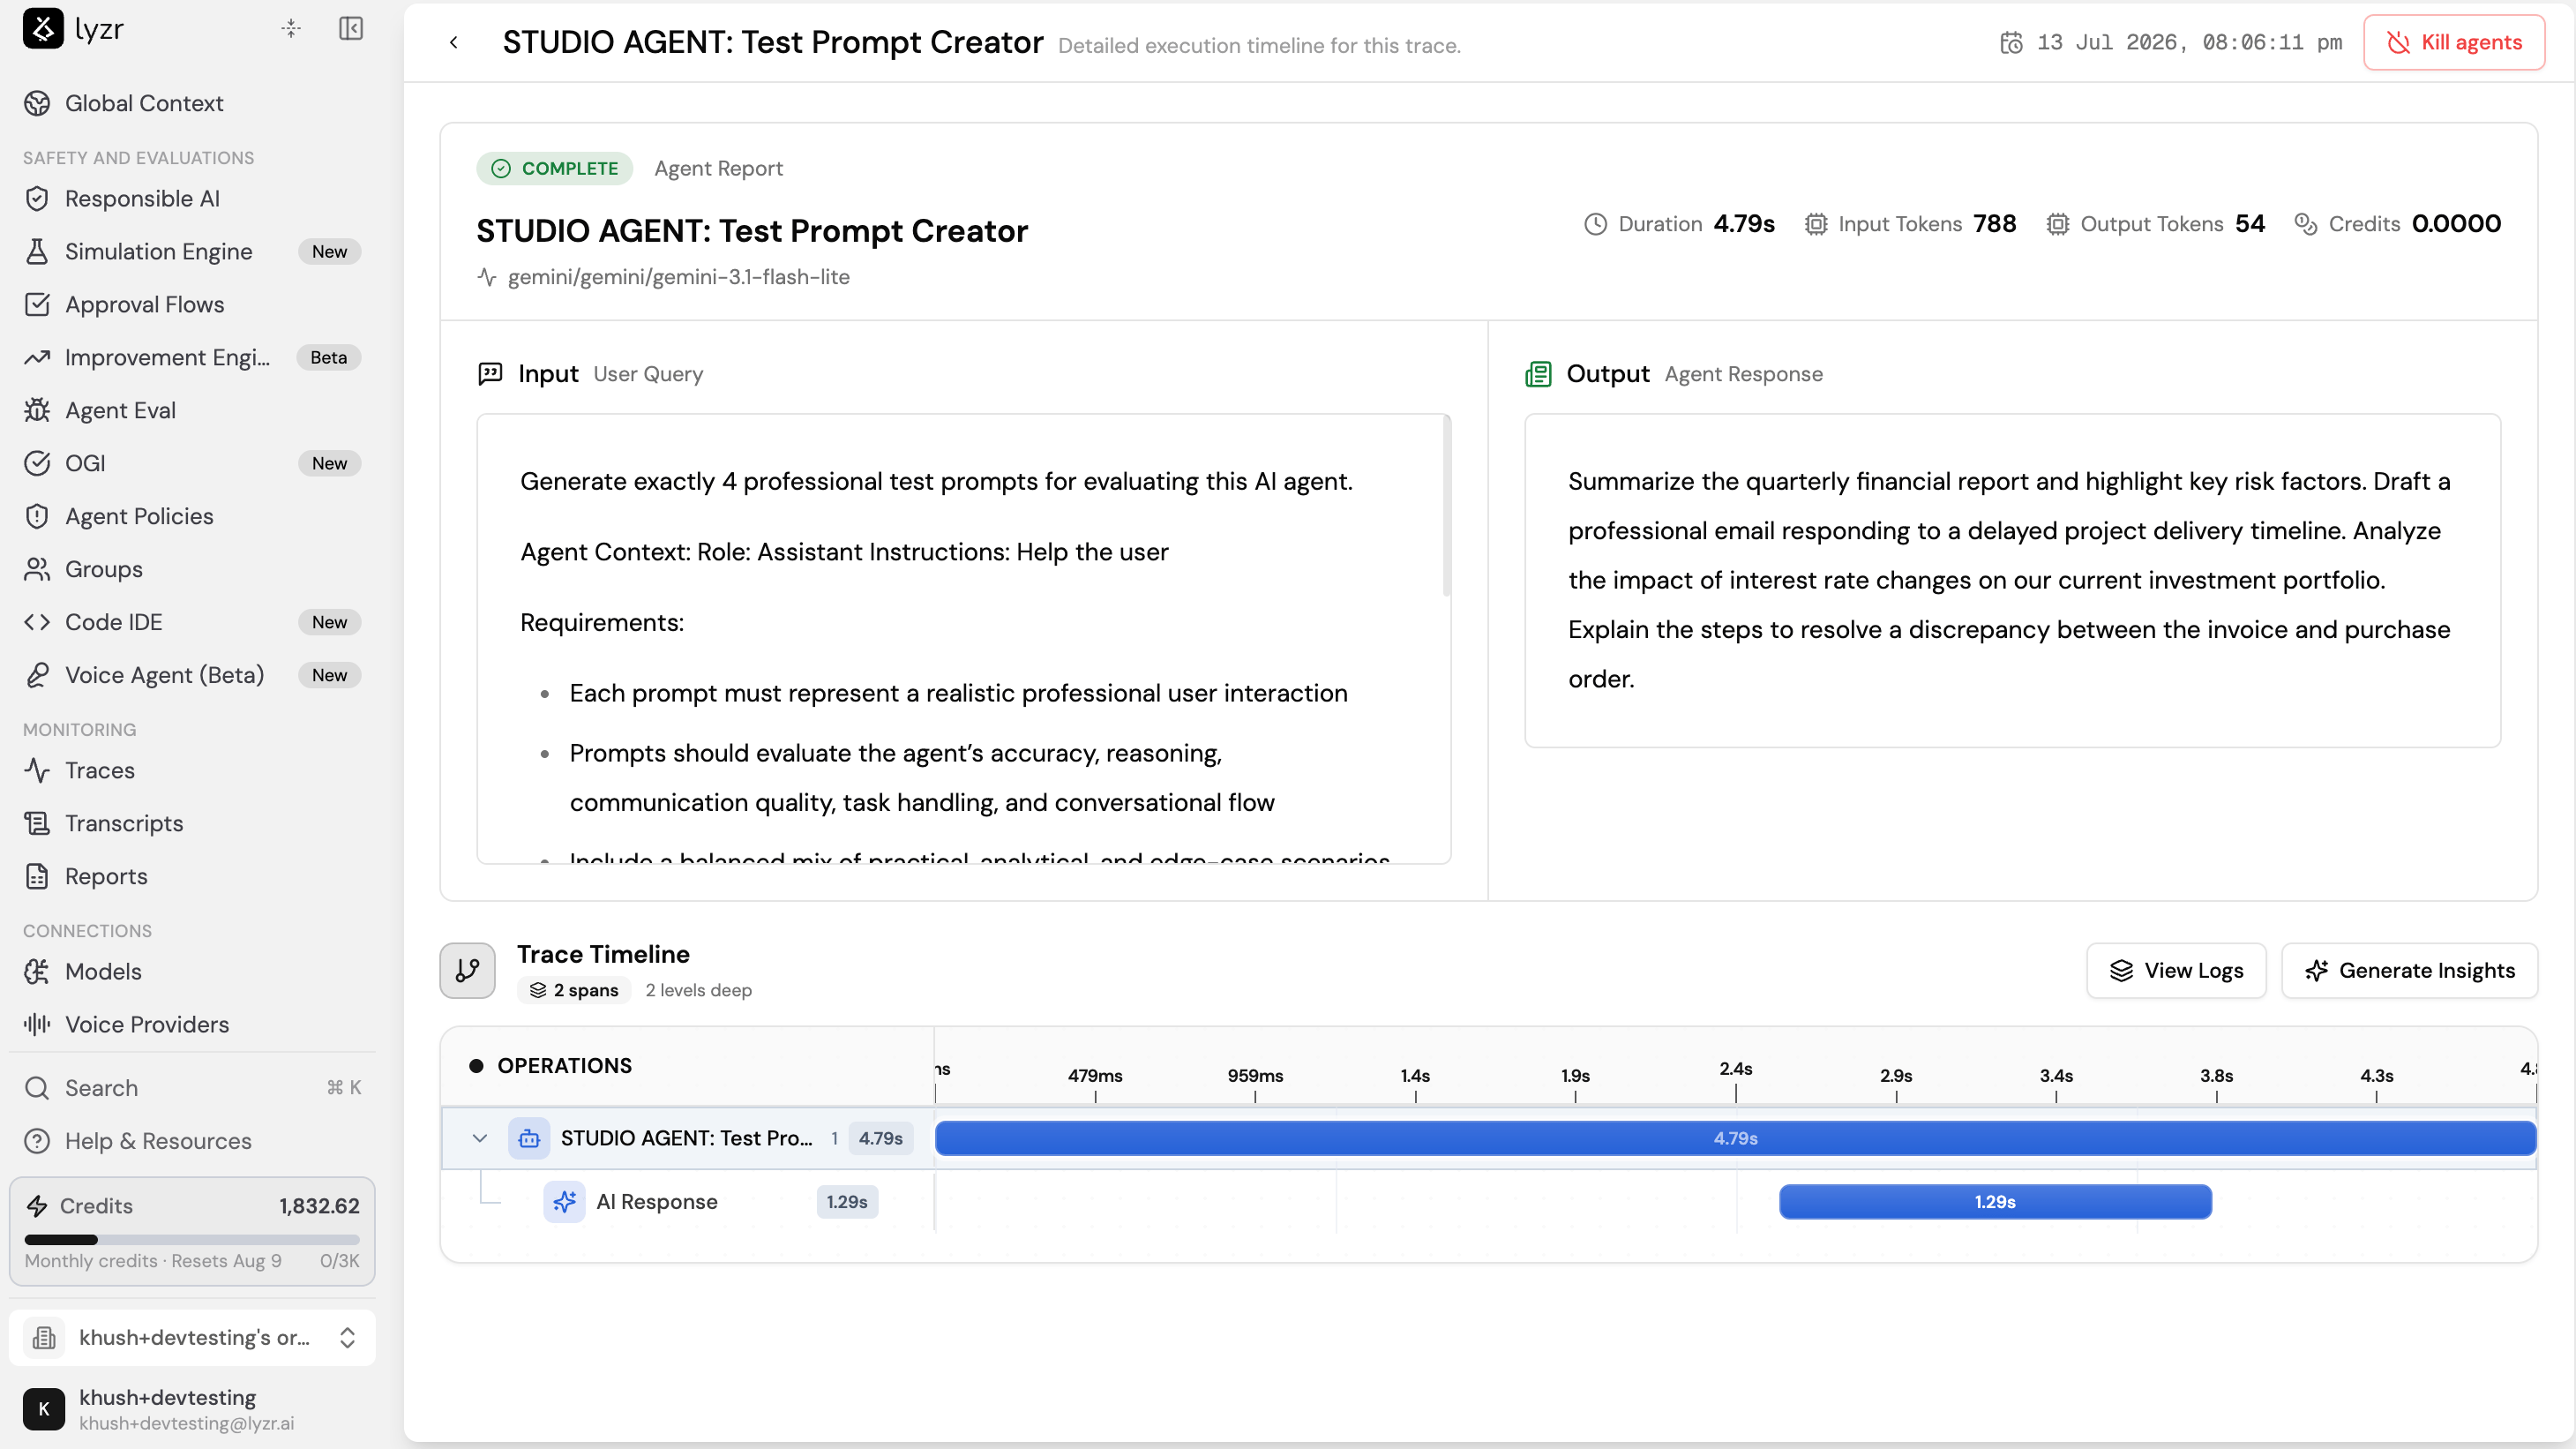
- Trace Verdict states which agent ran, what the user asked for, what the agent delivered, and an overall verdict on whether the request was fulfilled.
- Findings lists each behavior the utility agent identified, numbered and tagged with a status such as Worked. Each finding describes what happened and its impact on the output.